
Cost containment in emissions trading systems isn’t a fixed number you can budget for upfront. Instead, allowance prices under the EU ETS currently fluctuate between €50 and €90 per tonne of CO2, while compliance support and consulting fees add another €5,000 to €50,000 annually depending on your organization’s emissions profile and internal expertise. What drives this wide range? Trading strategy, hedging approach, regulatory compliance complexity, and whether you manage allowances in-house or partner with specialists.
These costs matter because they directly affect your bottom line and competitive position in carbon markets. Organizations that treat cost containment as purely transactional often overpay, while those who understand the underlying mechanics can stabilize budgets even as allowance prices shift. The European Commission’s Market Stability Reserve adjusts supply to prevent extreme volatility, but companies still need strategies to manage exposure.
Cost containment serves two purposes in this context: limiting your financial risk from carbon pricing while maintaining compliance with GHG reduction targets. Think of it as insurance paired with investment. You’re protecting against price spikes while potentially benefiting from strategic timing and operational improvements that reduce your total allowance needs.
The difference between proactive cost management and reactive purchasing can represent hundreds of thousands in annual savings for mid-sized emitters. Larger industrial facilities managing millions of tonnes face even steeper stakes. Yet many sustainability teams still approach carbon budgeting with outdated assumptions or insufficient market knowledge.
This guide breaks down the true cost structure of ETS participation, compares self-management against professional services, and provides frameworks to help you make informed decisions for 2026 and beyond. Whether you’re new to compliance or refining an existing strategy, understanding these financial levers puts you in control.
What Cost Containment in ETS Means for Your Bottom Line

Cost containment mechanisms directly affect your operational budget through three distinct channels: compliance costs when you need allowances above your allocation, administrative fees for participating in auctions and registry systems, and market stabilization charges that adjust based on carbon price volatility. If your facility emits 50,000 tons of CO2 annually but receives only 40,000 free allowances, that 10,000-ton shortfall becomes a real expense when carbon prices approach containment thresholds.
Price ceilings protect you from runaway carbon costs but trigger higher auction prices when demand surges. In California’s Cap-and-Trade program, the 2026 price ceiling sits around $89 per allowance (adjusted annually for inflation), significantly above the typical auction settlement price of $35-45. You only face these elevated costs when market prices climb near the ceiling and you need allowances from the reserve auction. Conversely, price floors, set at roughly $21.68 in California for 2026, ensure allowances never lose value entirely, which stabilizes long-term carbon investment planning but means you cannot capture ultra-low prices during market downturns.
Banking provisions let you carry unused allowances into future compliance periods without fees, giving you flexibility to smooth costs across years. If your emissions drop unexpectedly in 2026, those banked allowances become valuable assets for 2027 or 2028, when carbon prices may rise. Borrowing provisions, where available, let you use next year’s allowances for this year’s compliance, though some systems charge interest rates or restrict how many periods forward you can borrow.
The timing matters enormously. Smaller emitters under 25,000 tons often qualify for free allowance allocations that cover their entire footprint, eliminating direct costs. Mid-size facilities face partial exposure, while large industrial emitters bear the full weight of containment mechanisms and must budget accordingly for quarterly auctions and annual compliance deadlines.
Cost Containment Mechanisms by System Type

Price Ceiling and Reserve Auction Costs
When carbon prices climb too high, cost containment mechanisms activate price ceilings that protect businesses from market shocks while maintaining climate ambitions. Reserve auctions represent the most common ceiling approach, regulators hold back a portion of allowances and release them only when prices breach predetermined thresholds. California’s Cap-and-Trade program, for example, triggers reserve sales when allowance prices exceed inflation-adjusted levels around $75-80 per ton in 2026, with tiered pricing that increases as you move up the reserve pool.
The premium you’ll pay at these ceiling auctions typically runs 40-60% above baseline market prices. If regular allowances trade at $60, reserve allowances might cost $85-95, creating a financial buffer that discourages excessive demand while preventing economically disruptive price spikes. Safety valve mechanisms work similarly but set absolute price caps, once hit, unlimited allowances become available at the ceiling price, effectively putting a firm lid on costs.
Your actual exposure depends on your compliance strategy and market timing. Organizations managing EU ETS compliance face the Market Stability Reserve, which adjusts supply dynamically rather than through fixed ceilings, while RGGI participants encounter reserve prices that adjust quarterly. The key planning insight: budget for reserve auction premiums in high-price scenarios, but recognize these mechanisms rarely activate in well-designed markets, they’re insurance against extreme volatility, not routine costs.
Price Floor and Minimum Auction Prices
Price floors establish a safety net beneath carbon markets, preventing allowance prices from dropping so low that they fail to incentivize emission reductions. Most cap-and-trade systems implement minimum auction prices, the floor at which allowances can be sold during quarterly or annual auctions. In 2026, California’s Cap-and-Trade program maintains a minimum auction reserve price around $23 per allowance (adjusted annually for inflation), while the Regional Greenhouse Gas Initiative operates with tiered reserve prices starting near $3.23.
These minimums create predictable baseline costs for compliance entities. A facility needing 10,000 allowances faces a guaranteed minimum expenditure of $230,000 in California, regardless of market conditions. This certainty helps businesses budget for carbon costs and prevents the boom-bust cycles that plagued early emissions markets when prices collapsed to mere cents per ton.
The revenue generated from minimum price auctions flows directly into climate resilience programs. California’s auction proceeds fund affordable housing retrofits, wildfire prevention, and transit electrification. RGGI states direct minimum auction revenues toward renewable energy deployment and energy efficiency rebates for low-income households.
Price floors also maintain the economic signal that carbon carries a cost. When allowances sell at the minimum reserve price, it signals market oversupply, often triggering containment reserve mechanisms that withdraw excess allowances from circulation. This dual function stabilizes prices while accelerating the path toward meaningful emission reductions, ensuring that even in periods of economic slowdown, climate investment continues.
Where Cost Containment Dollars Actually Go

Understanding where your cost containment dollars flow transforms abstract compliance expenses into tangible climate action. When businesses purchase allowances from reserve auctions or pay into safety valve mechanisms, those funds don’t disappear into bureaucratic voids, they fuel the transition to a low-carbon economy.
Most ETS programs direct cost containment revenues toward four primary channels:
- Administrative operations (5-10%): Market oversight, registry management, verification systems, and enforcement programs that keep the trading system transparent and fraud-resistant
- Climate resilience and adaptation funds (25-35%): Coastal protection projects, drought-resistant agriculture programs, wildfire prevention infrastructure, and community emergency preparedness initiatives
- Economic transition assistance (20-30%): Worker retraining programs for fossil fuel industry employees, small business grants for emissions reduction projects, and support for communities historically dependent on carbon-intensive industries
- Renewable energy and efficiency investments (30-45%): Solar and wind project financing, building retrofits, public transportation electrification, and grid modernization to handle distributed clean power
California’s Cap-and-Trade program demonstrates this distribution model in practice. Between 2012 and 2024, the state allocated over $18 billion from auction proceeds, with roughly 35% funding affordable housing near transit, 28% supporting clean transportation initiatives including electric vehicle rebates, and 25% backing renewable energy development. Disadvantaged communities received at least 35% of these investments, turning market mechanisms into environmental justice tools.
The EU ETS takes a different approach through the Innovation Fund and Modernisation Fund. Reserve auction revenues finance breakthrough technologies like green hydrogen production and carbon capture pilots while helping Eastern European member states upgrade energy infrastructure. This dual focus addresses both cutting-edge decarbonization and equitable transition challenges.
Regional systems like RGGI distribute proceeds primarily to energy efficiency programs and renewable costs reduction initiatives. Connecticut, for instance, channels roughly 80% of its RGGI revenues into home weatherization and commercial building efficiency upgrades, directly lowering energy bills while cutting emissions. Maryland uses similar funds to support offshore wind development and solar panel installations in low-income neighborhoods.
The transparency varies considerably across systems. Some jurisdictions publish detailed quarterly reports showing exactly which projects received funding, while others provide only aggregate categories. This accountability matters, knowing your compliance dollars support concrete projects like a new solar farm in your region or job training for displaced coal workers makes the expense feel less like a penalty and more like an investment in community resilience.
Six Factors That Influence Cost Containment Expenses
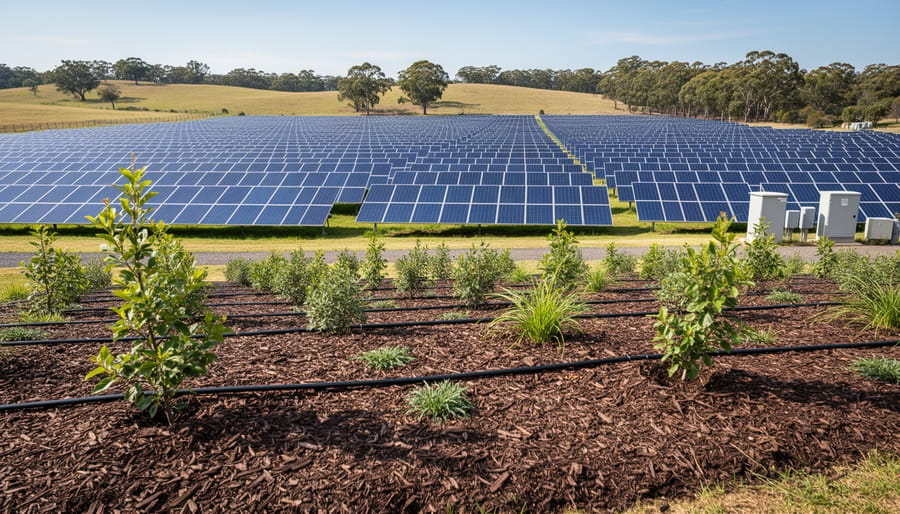
Understanding which forces drive cost containment expenses up or down lets you budget smarter and spot opportunities before they vanish. Six variables consistently shape what organizations pay for compliance mechanisms and how much buffer they need when markets swing.
- Market volatility levelsWhen carbon prices jump wildly week to week, reserve auction participation spikes as emitters scramble for safety valves. California’s 2023 price surge saw reserve auction volumes triple compared to stable 2021 levels, directly raising costs for participants seeking ceiling protection. High volatility also pushes more organizations toward banking allowances early, creating upfront cash flow impacts even when long-term savings materialize.
- Emission cap stringencyTighter caps mean fewer allowances chasing the same emissions, pushing prices toward upper containment thresholds more frequently. The EU ETS Phase IV cuts caps 4.3% annually through 2030, making Market Stability Reserve interventions more common and driving up the frequency organizations hit price ceiling mechanisms. Stricter targets directly translate to higher probability of needing costly backstop measures.
- Economic growth ratesIndustrial expansion increases emissions faster than gradual cap reductions, creating scarcity that drives prices upward. Regional manufacturing booms or energy demand surges compress the gap between available allowances and actual needs, forcing more participants into reserve auctions. Conversely, economic slowdowns reduce demand and lower the likelihood of triggering expensive containment mechanisms.
- Technology availabilityBreakthrough abatement technologies shift the curve dramatically. When cost-effective carbon capture or electrification options emerge, demand for allowances drops and prices stabilize below ceiling thresholds. Organizations in sectors with accessible alternatives face lower containment costs because market-wide pressure eases. Those in hard-to-abate industries without proven solutions carry higher risk of needing premium-priced safety valves.
- Banking restrictionsSystems limiting how many allowances organizations can carry forward force more current-period purchases when prices spike, eliminating the flexibility to wait out volatility. Strict banking rules in some regional systems mean participants must absorb high costs during peak years rather than smoothing expenses across multiple compliance periods, raising average containment spending over time.
- Linkage with other systemsCarbon market linkage expands the allowance pool and dampens price extremes by letting participants track CO2 units across jurisdictions. California and Quebec’s linked system stabilizes prices compared to isolated markets, reducing how often either region hits containment triggers. More linkages generally mean lower containment costs through increased liquidity and geographic diversification of emissions pressure.
These factors rarely operate in isolation. A booming economy combined with strict caps and limited banking can create perfect conditions for sustained high containment costs, while technology breakthroughs during slower growth periods might keep expenses minimal for years. Track which variables apply to your jurisdiction and industry to forecast when budget pressure will likely intensify.
Internal Management vs. Third-Party Cost Containment Services
When to Build In-House Capacity
Building in-house cost containment capacity makes financial sense when your organization consistently faces allowance transactions exceeding $500,000 annually. At this threshold, dedicating one full-time compliance specialist pays for itself within 18 to 24 months through avoided consulting fees and optimized trading strategies.
Organizations with stable, predictable emissions profiles benefit most from internal teams. If you can reliably forecast quarterly allowance needs and your operations span multiple compliance periods, an in-house expert develops institutional knowledge that consultants cannot match. They understand your facility’s specific emission patterns, seasonal variations, and operational constraints that affect allowance timing.
Large industrial emitters with over 100,000 tonnes CO2e annually typically justify a two-person team: one for regulatory compliance and reporting, another for market analysis and trading execution. The upfront investment in training and market monitoring tools ranges from $75,000 to $150,000, but ongoing costs drop to staff salaries plus annual software subscriptions around $15,000.
The strategic advantage extends beyond cost savings. Internal teams respond faster to market volatility, execute complex hedging strategies, and integrate carbon costs directly into operational planning without external coordination delays.
When Professional Services Make Sense
Third-party cost containment services often prove more economical for organizations emitting fewer than 25,000 tonnes CO2 annually. At this scale, the specialized expertise required to navigate allowance auctions, price volatility hedging, and compliance reporting typically exceeds the cost of a dedicated full-time employee, yet doesn’t justify hiring one.
New market entrants face particularly steep learning curves. Professional services provide immediate access to established relationships with allowance brokers, real-time market intelligence, and proven compliance workflows. This compressed timeline matters when missing a quarterly auction or misunderstanding reporting deadlines can trigger costly penalties. First-year participants often see professional guidance pay for itself through avoided compliance errors alone.
Multi-jurisdiction operations present complexity that favors external expertise. If your organization holds obligations across EU ETS, California Cap-and-Trade, and RGGI simultaneously, maintaining current knowledge of three distinct cost containment mechanisms, banking provisions, and offset protocols becomes a full-time specialization. Consultants who serve multiple clients across these systems spread their expertise development costs across their client base, making specialized knowledge affordable for individual participants.
Companies anticipating significant operational changes, facility expansions, fuel switching, or market exits, benefit from consultants who’ve guided similar transitions dozens of times, avoiding expensive missteps during critical planning windows.
What Changes the Price
Market volatility drives cost containment prices through several interconnected forces. When industrial production surges or economies recover quickly, demand for allowances intensifies, pushing prices toward ceiling mechanisms and activating reserve auctions at premium rates. Conversely, economic downturns reduce emissions, lowering demand and potentially triggering floor protections.
Political decisions reshape pricing overnight. New climate legislation can tighten caps, restrict allowance supply, or introduce stricter compliance deadlines, all raising costs. Changes in offset eligibility or international linking agreements also shift price dynamics, as emission diagrams reveal how linked systems create arbitrage opportunities or supply shocks.
Technology breakthroughs matter too. When renewable energy becomes cheaper or carbon capture scales up, emissions decline faster than anticipated, reducing allowance demand and lowering containment mechanism activation. Banking behavior amplifies these swings, firms hoarding allowances during low-price periods create artificial scarcity later, while mass selling floods markets.
Weather patterns shouldn’t be overlooked. Extreme temperatures spike electricity demand, forcing coal plants online and exhausting allowance reserves. Each factor compounds the others, making cost containment expenses less about fixed fees and more about reading market signals strategically.
Common Questions About Cost Containment Expenses
How frequently do cost containment mechanisms activate in practice?
For most established systems, price ceiling mechanisms trigger during periods of economic volatility or supply shocks, typically less than 10% of auction periods in mature markets like the EU ETS. Price floors activate more regularly in newer systems still finding equilibrium. California’s system saw reserve sales in roughly 15% of auctions between 2022-2025, while RGGI’s price floor has provided consistent support since its 2021 adjustment. Understanding your specific market’s historical trigger frequency helps you forecast the likelihood of facing containment-related costs in any given compliance period.
Can small emitters qualify for fee waivers or reduced cost containment obligations?
Many systems include de minimis thresholds or simplified compliance pathways for facilities emitting below specific levels, often 25,000 tons CO₂e annually. However, these exemptions typically apply to baseline compliance requirements rather than cost containment mechanisms themselves. If you participate in allowance auctions or need reserve purchases, you’ll face the same per-ton costs as larger emitters, though your total exposure remains proportionally smaller.
What happens to our budget when carbon prices spike unexpectedly?
Price spikes are precisely when cost containment mechanisms should protect you, reserve auctions release additional allowances at predetermined ceiling prices, preventing runaway costs. The key is ensuring you’ve budgeted for the ceiling price itself, not just current market rates. Build contingency reserves equal to 20-30% above current prices to avoid scrambling for capital during volatility.
How should organizations budget for cost containment uncertainty?
Model three scenarios annually: baseline (current prices hold), moderate activation (reserve sales at 10-15% of your allowance needs), and full ceiling trigger (purchasing 100% of marginal needs at maximum prices). Most prudent compliance teams budget at the moderate scenario while maintaining access to credit facilities for worst-case exposure.
Managing unexpected administrative fees and auction costs
Beyond the allowance prices themselves, organizations sometimes encounter surprise costs in participation fees, transaction charges, or expedited processing premiums when accessing cost containment mechanisms under time pressure. California’s reserve sales, for example, include administrative fees separate from allowance costs. Review your system’s complete fee schedule annually and factor these ancillary costs, often $500 to $5,000 per transaction, into your compliance budget. Setting up pre-authorized accounts and maintaining current registration eliminates last-minute rush fees.
Strategies to minimize cost containment exposure
The most effective approach combines over-compliance banking during low-price periods with strategic hedging. Organizations that consistently surrender 5-10% more allowances than required during favorable markets build buffers that insulate them from ceiling-price purchases later. Participating in forward markets or compliance service agreements can lock in costs years ahead, essentially self-insuring against containment mechanism activation. This proactive strategy transforms cost containment from an unpredictable budget risk into a manageable, forecasted line item that supports both compliance certainty and long-term decarbonization planning.
Understanding cost containment mechanisms in emissions trading systems transforms what might seem like regulatory overhead into strategic investment in climate stability. The dollars allocated to price ceilings, reserve auctions, and floor mechanisms don’t disappear into bureaucratic coffers, they fund renewable infrastructure, support community resilience programs, and ensure carbon markets remain functional tools for decarbonization rather than volatile speculation platforms.
For organizations navigating ETS compliance in 2026, cost containment expenses represent predictable parameters around carbon pricing uncertainty. Knowing when price floors activate, how reserve allowances get triggered, and what threshold costs look like across different systems allows finance teams to model scenarios with confidence. This isn’t guesswork, it’s data-driven climate action planning.
The distinction between in-house management and professional services ultimately depends on scale, but the underlying principle remains constant: effective cost containment participation requires understanding the mechanisms thoroughly enough to time decisions strategically. Whether you’re a multinational corporation planning multi-year compliance strategies or a medium-sized manufacturer entering carbon markets for the first time, mastering these financial dynamics delivers competitive advantage alongside environmental impact.
Mining the Sun offers resources that connect cost containment strategy to broader sustainability goals. Our community explores how carbon market participation intersects with renewable energy investments, regenerative agriculture projects, and verified offset opportunities. Join conversations with practitioners who’ve navigated these systems successfully, access tools that simplify compliance planning, and discover projects where your carbon investments generate measurable climate benefits. Building fair, effective carbon markets requires informed participants, start here.